This study shows that, contrary to preconceptions, CEOs and stars of the sport and entertainment industry are not the first ones to blame for rising inequalities. The evolution of the wages of finance managers has actually contributed greatly to the phenomenon.
The rise in inequality in the United States is by now almost common knowledge. [1] This phenomenon is not limited to the USA alone but is much more general and international. [2] Figures from Landais show that in France, inequalities have been increasing again at a significant rate, but only since the late 1990s. [3] The analytical description and interpretation of this rise in inequalities is also only just beginning. One element of this trend that has been widely commented is the tremendous rise in CEO pay over the last thirty years. [4] Another element is the increase in compensations in the entertainment industry for sporting or artistic superstars. However, it is not certain that those visible elites account for much of the rise in inequality. More recently, partly thanks to the financial crisis and the bonus outrage, the importance of financial wages has been under scrutiny. [5] Bell and Van Reenen estimate that 70% of the recent increase of the share of the top 1% in the United Kingdom was captured by workers of the financial industry. [6]
The goal of the following paper is to investigate the transformation of inequalities in France. To that aim, we rely on the DADS data (1976-2007), the French Social Security wage data for the private sector [7]. Such data enable us to ask questions on the changing patterns of wage inequalities in France. Firstly, how reliable is the rise in inequalities discovered by Landais with self-declared fiscal sources? If this trend is robust, then who does account for it? CEOs, managers, experts, entertainment superstars? Since Paris finance is not as wealthy as that of London or Wall Street, does it account for as much of the rise in inequalities?
DADS: a unique database to study wages in France
The DADS, Déclaration Annuelle de Données Sociales, is a statistical dataset based on an administrative source. In order to collect social contributions for the Social Security – payroll taxes which are more or less proportional to an employee’s wage – the French government collects all wages from the private sector.On the basis of these administrative records, two main datasets are available. The first is the Panel DADS (1976-2007), which contains 1/24th of the private sector wage earners from 1976 to 2001 and 1/12th of the same population after 2001. The second dataset is made up of exhaustive files of all jobs in the private sectors from 1994 to 2007.
First, in the panel (1976-2007) and in the 2002-2007 exhaustive files, we use the annual sum of gross wages by individuals that are over half a minimum wage. As it is not possible to identify a worker from one job to another in the 1994-2001 exhaustive files, we use the annual gross wage of full-time non-annex jobs that are over half a minimum wage.
Wage Evolution in France
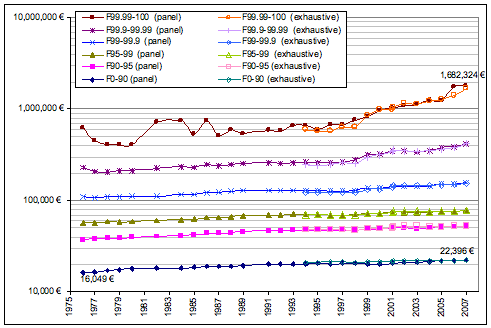
In order to analyze the evolution of inequalities, we calculate fractiles at the top of the wage distribution. [8] Graph 1 shows the evolution of wages for different fractiles. We find a global increase of wages but at different rates for each fractile. F0-90 is increasing rather slowly. On the whole, F90-95, F95-99 and F99-99.9 seem to increase regularly and at the same rate. F99.9-99.99 and F99.99-100, especially over the last ten years, increase more quickly. In 2007, the top 0.01%, that is the 1692 highest-paid persons in the private sector, earning more than 867,000 Euros, were paid on average 1,682,000 Euros a year, whereas the F0-90 evolved between 7600 and 46,700 in gross salary and earned on average 22,400 Euros a year.
Graph 1. Evolution of constant wages of the different fractiles (in euros, 2007)
Note : In 2007, the mean salary in the top 0.01% was 1,682,324 euros. Sources : Panel DADS (1976-2007) and France – exhaustive job files DADS (1994-2007).
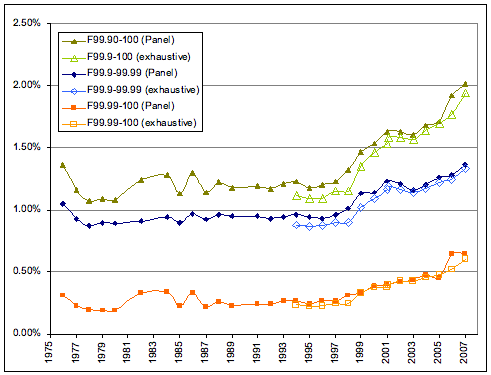
The consequences of this trend are the following. The share of the majority (F0-90) is globally declining, losing 2 points in 30 years. The share of the “middle classes” defined by the fractiles between P90 and P99.9 remains globally stable or is increasing at a slow rate. When we move to the top 0.1%, however, we can see a sharp increase in their share after the year 1996. The share of the top 0.1% increases by 0.8 points, moving from 1.2% in 1996 up to 2.0%. Half of the 0.8-point increase is for the top 0.01% and half for the F99.9-99.99. Graph 2. Evolution of the share of the top 0.1% wage.
Graph 2. Evolution of the share of the top 0.1% wage
Note : In 2007, the top 0.1% was paid 2.0% of the salaries. Sources : Panel DADS (1976-2007) and France – exhaustive job files DADS (1994-2007).
The Role of Finance
A sector approach enables us to describe more precisely the type of business managers that contributed the most to the increase in inequalities. Some sectors such as industry, retail and restaurants, transport and communication are now much less represented at the top of the wage hierarchy than they were 30 years ago. For instance, 38% of the top 0.1% worked in the industry in 1976, whereas only 14% did so in 2007. On the other hand, service to business, finance, and to a lesser extent entertainment and other services increased among the highest-paid workers. In 1976, 10% of the top 0.1% were in service to business and 6% in finance. In 2007, they were 26% and 24% respectively. Moreover, the increase and decrease in the different sectors at the top should be compared to their evolution as a whole inside the private sector. Thus, service to business is a sector in which the headcount has grown quite rapidly during the last quarter of a century, whereas the number of workers in finance has remained a fairly stable proportion of the private sector (3% of private sector employees). In the early 1980s finance industry, financial workers were twice as present in the top 0.1% as they were under this threshold. This ratio increased smoothly in the 1980s and very sharply in the 1990s. In 2001 it peaked at 10, as a result of the considerable bonuses granted after the excellent year 2000 on the market.
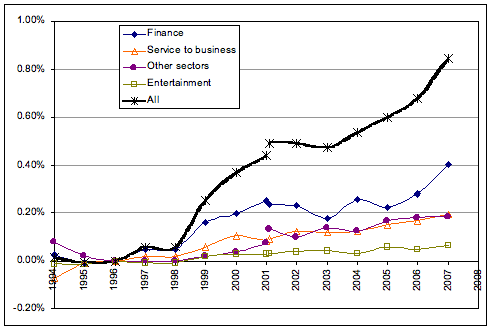
Therefore, we can try to quantify the contribution of this sector to 1996-2007 increase in inequalities. We follow here Bell and Van Reenen [9]. We calculate the contribution of finance, service to business, entertainment and other sectors to the 0.85-point increase of the wage share. We find that finance contributed to 48% of this rise, whereas service to business and other sectors each contributed to nearly 23%, and entertainment to 8% of the rise (Graph 3).
Graph 3. Contributions to the increase of the share of the top 0.1%
Note : Between 1996 and 2007, the share of the top 0.1% globally increased by 0.85 points and the share of finance within this fractile increased by 0.40 points. Sources : France – exhaustive job files DADS (1994-2007).
When we move into the top 0.01%, we find that finance makes a contribution of 57% to the increase in the share of the working Rich. At the end of the period, finance constitutes 37% of the headcount of the top 0.01%, which are 19.4 times more present at this level than below. Overrepresentation of this sector in that fractile is much higher than that of service to business (2.3) or entertainment (6.7).
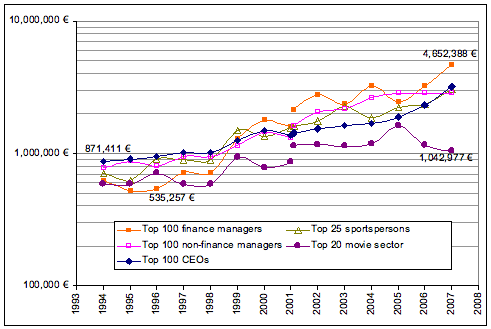
Finally, Graph 4, which compares the evolution of top salaries, enables us to sum up some of our main findings. In the graph, we analyze the evolution of the top 100 finance managers (people working in finance sector as “cadres”), the top 100 non-finance and non-entertainment managers, the top 100 CEOs, the top 25 sportspersons, and the top 20 wage-earners in movies, TV and the video sector (most of whom were actors). Between 1996 and 2007, wages increased by 1.5 in this latter group, by 3.3 in sports and among the top CEOs, by 3.6 among the top non-finance managers, and by 8.7 among the top 100 finance managers. Graph 4. Evolution of the top wages for several well-known jobs.
Graph 4. Evolution of the top wages for several well-known jobs.
Note : In 2007, the top 100 Finance managers were paid 4,652,388 euros. Evolutions are in 2007 constant euros. Sources : France – exhaustive job files DADS (1994-2007).
Therefore, the most scrutinized highly-paid professionals, such as CEOs and entertainment superstars, are not the most responsible for the increase in inequalities in comparison with finance managers, in particular heads of desks and heads of trading rooms [10].
The Political Implications of This Study
France has experienced a strong increase in inequalities over the last 12 years. Half of the increase of the share of the top 0.1% is due to an increase in pay among top finance managers. On the other hand, CEOs and entertainment superstars did not seem to play a major role in the increase in inequalities.
A better knowledge of high salaries is important in order to measure the importance of rents and of talent in the dynamics of inequalities. It has also obvious policy implications all the more so as taxation of finance workers and taxation of high incomes have received contradictory attention in the public debate. France, during the last decade, as in many developed countries, has been lowering the tax rates for the highest incomes, after some consideration of the positive effects of those elites on overall activity. At the same time, CEOs during the whole decade, finance workers after 2007, and sportspeople after the 2010 world cup defeat, have been widely criticized. Both the meritocratic character of their pay and the usefulness of their economic role have been subject to debate. It should be noted that those categories are not marginal among top wages in France. In the top 0.01% of wages for 2007, we find nearly 40% of finance workers, 20% of CEOs and 10% of sportspeople. Taxing this fractile of salary more would be another way (perhaps more easily achieved than a sectorial tax) to redistribute those salaries, which a growing number of citizens consider as rents.
A longer version of this article is available online.
To quote this article :
Olivier Godechot, « Finance, an Inequality Factor »,
Books and Ideas
, 15 April 2011.
ISSN : 2105-3030.
URL : https://laviedesidees.fr/Finance-an-Inequality-Factor
Nota Bene:
If you want to discuss this essay further, you can send a proposal to the editorial team (redaction at laviedesidees.fr). We will get back to you as soon as possible.
Footnotes
[1] Cf. Thomas Piketty and Emmanuel Saez, “Income Inequality in the United States, 1913-1998”, Quarterly Journal of Economics, 118(1), 2003, pp. 1-39.
[2] Cf. Atkinson, Tony, Thomas Piketty and Emmanuel Saez, “Top Incomes in the Long Run of History”, Journal of Economic Literature, 2011 forthcoming.
[3] Cf. Camille Landais, “Top incomes in France (1998-2006): Booming inequalities?”, PSE Working Paper, 2009.
[4] Cf. Lucian A. Bebchuk and Yaniv Grinstein, “The Growth of Executive Pay.” Oxford Review of Economic Policy, 21, 2005, p. 283–303 ; Xavier Gabaix and Augustin Landier, “Why has CEO Pay increased so much?”, Quarterly Journal of Economics, 123, 2008, pp. 49-100.
[5] Cf. Thomas Philippon and Ariell Reshef, “Human Capital in the U.S. Financial Industry: 1909-2006.” NBER Working Paper No. 14644, January 2009 ; Steve Kaplan and Joshua Rauh, “Wall Street and Main Street: What Contributes to the Rise in the Highest Incomes?”, Review of Financial Studies, 23(3), 2010, pp. 1004-1050.
[6] Cf. Brian Bell and John Van Reenen, “Bankers’ pay and extreme wage inequality in the UK”, Center for Economic Performance, 2010.
[7] Access to the data was obtained through the CASD dedicated to researchers authorized by the French Comité du secret statistique.
[8] F99.99-100 stands for the top 0.01% of the salary distribution. F99-99.9 stands for people who are in the top 1% but not in the top 0.1% of the salary distribution.